Resources for Forecasting 🔮

Time series data is everywhere. You can find time series in retail settings, where sales of products in different categories are tracked over the weeks, days, hours, etc. You can also find them in things like energy production, where it’s important to understand the demand for electricity in a city over a day and how much energy the grid needs to support.
However we often find that it’s an overlooked area of data science, with some unaware that these techniques even exist. So we’ve put together this post covering what time series data is, why it’s useful to analyse as a business and some of the tools you can use if you want to jump in and do your own analysis.
What is a Time Series?
A time series is a collection of measurements taken repeatedly over time. You will commonly see time series points taken at regular intervals, for example every minute, hour, day, etc. But you can have situations where the time series are irregular and data is collected when there is an opportunity to do so, for example the times of events such as earthquakes or floods. We usually break down a time series as a series of components which makes it easier to explain and communicate the underlying process. These components are:
- Trend - The overall direction of the time series, you can think of this as a long term view of the time series.
- Seasonality - The seasonal fluctuations, do we see different behaviours on a Sunday than we would on a Friday? Are there differences in the months of our dataset? These are the questions the seasonal component will answer. To do this though we need to understand the cycles in our data set (which often comes down to the time intervals the data is being collected at and the process generating the data).
- Remainder/Irregular - Everything else, these are the components that are left in the data when we take away trend and seasonality. There’s often interesting insights when looking at the remainder and whether there are other factors that explain what’s going on, things like public holidays can often affect people’s behaviour and lead to irregularities in a time series.
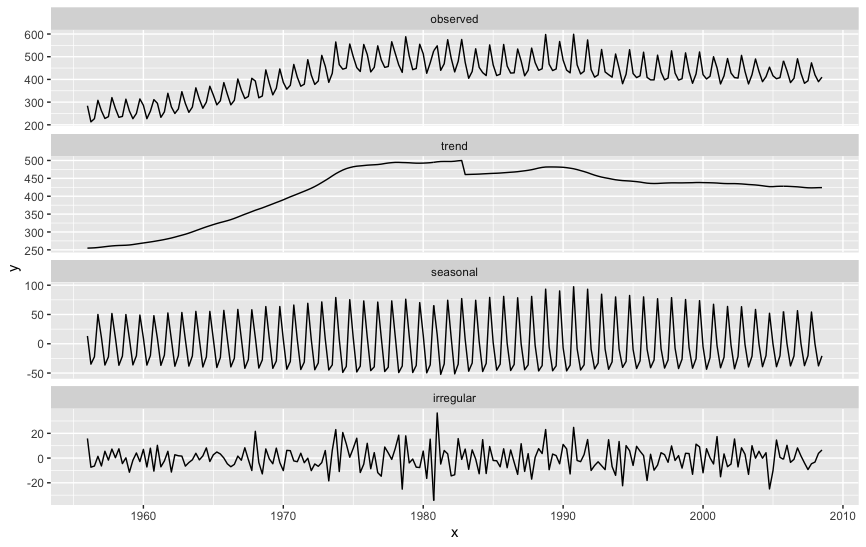 Australian Quarterly Beer Production
Time Series Analysis
There are many reasons why you may want to analyse a time series, one of the most obvious being to predict the future. Keep in mind though,
’… all models are approximations. Essentially, all models are wrong, but some are useful. However, the approximate nature of the model must always be borne in mind….’ - George Box
Considering this, we can still get useful information from analysing time series data, including:
- Prediction - It may only be an approximation, but it can still be useful for planning and organising. Most modelling techniques also provide confidence intervals where we can understand what range we can expect to see that value occur within.
- Anomaly Detection - Often thresholds are set for detecting anomalies in time series, these work in extreme cases (above or below a set value) but there can still be cases where this misses unusual patterns we weren’t expecting to see. Using time series we can understand what’s an anomaly at a certain point in time, e.g. for 9 a.m. on a Monday morning.
- Change Point Detection - At what points did our time series change in some way? For example if there was a sudden impact in the trend, we’d want to observe that in the analysis. This allows us to identify events in our time series worth investigating and understanding further with a bit of detective work.
- Hierarchical Modelling - We may need to break down a time series into the different components that it’s made up of. For example if we are predicting tourist visits to Australia, we would like to know the overall figures for Australia, but we might like to break it down into different models for each state and territory (QLD, NSW, VIC, SA, WA, TAS, ACT, NT, JB).
- Understanding Relationships - Once we have an understanding of underlying trend and seasonality we can look at the remainder and correlate that with other factors and information we are collecting. For example, we may have a time series with the number of visitors to a beach each day over the year, but if we also include something like amount rain, we’ll be able to explain why we received less visitors to a beach on a weekend in Summer when it’s been raining.
- Counterfactuals (Advanced) - This is where we are trying to measure the impact of a change we’ve made but are unable to run a controlled experiment. One technique is to use forecasting to estimate what would have happened if we had have made no changes to the process and then compare that to what actually happened.
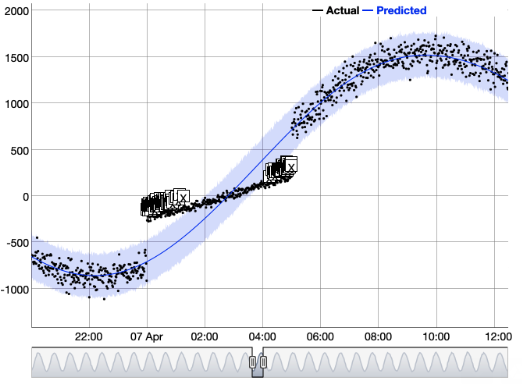 Detecting Anomalies with Forecasting
Tools for Forecasting
If you’re just getting started with time series the best place to start is this free online resource, Forecasting: Principles and Practice by Rob J Hyndman and George Athanasopoulos. It provides a comprehensive overview of the field with excellent guides around how to format, analyse, model and visualise time series data (with examples in R).
Some other tools and resources we’ve found useful when looking at Time Series include:
- Lubridate - Dealing with time data can be a headache, this package makes it as simple as possible to get the data in the right format for analysis.
- Forecast - An R package with great tools for building time series models
- Dygraphs - Interactive graphs for time series data in javascript
- BSTS - Bayesian Structured Time Series, very useful for looking at relationships between time series
- Prophet - A forecasting library from Facebook in both R and Python. Excellent for making lots of models without too much fine-tuning
- LSTM - Long Short Term Memory is a type of neural network does a good job of modelling time series data
- APIs - There’s some great APIs available from Amazon and Microsoft that allow you to get up and running on their cloud platforms
If you want to discuss time series analysis with us, or have any questions about the material above, feel free to continue the conversation with us on twitter. Have fun forecasting! 📈